About Cornerstone Fair Value Model

For over 30 years, Cornerstone’s Fair Value Model has performed a weekly appraisal for the value of each of the 800 companies that we cover in the large-cap universe. By identifying companies with consistent and predictable earnings streams as well as applying an appropriate multiple to companies based on their financial and operating leverage, the Cornerstone Fair Value Model has been able to identify those companies with a greater chance to outperform. History has demonstrated that an attractive relative valuation has been a key determinant of outperforming companies.

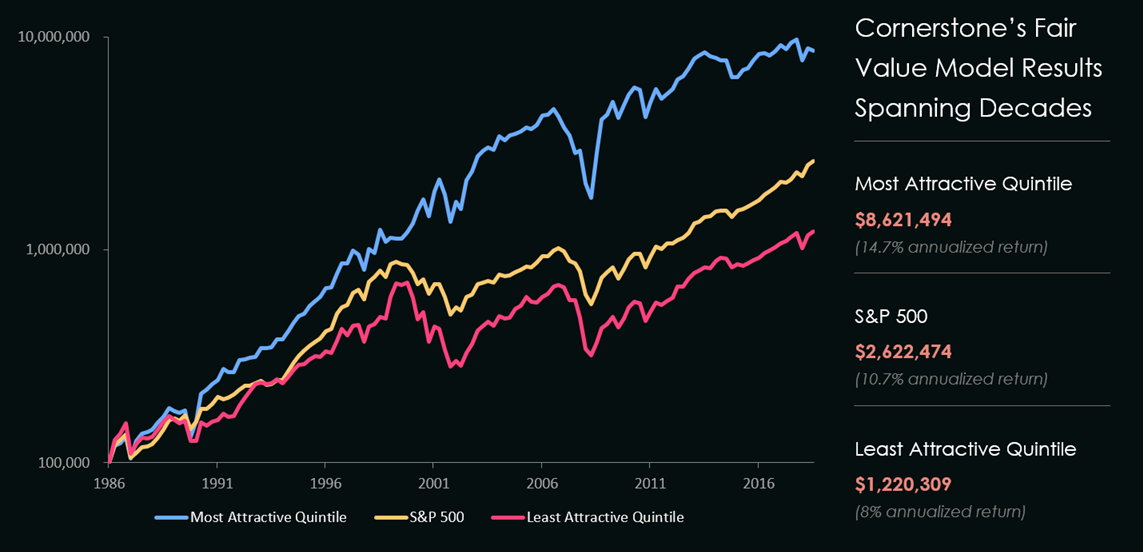
As illustrated in the chart below, those companies that fall within the first quintile (most attractive stocks) have outperformed the S&P 500, as well as the least attractive companies in the fifth quintile by a significant margin since its creation in 1987. Read on for a more complete description of how cornerstones fair value model operates, or contact us directly for more details.


Cornerstone’s Fair Value Model not only identifies stocks that appear attractive, but allows users to explore why the stock appears undervalued. The focus of the model helps you direct further research into the factors that determine the Fair Value: profitability, earnings power, leverage, payout policies, etc. Our 800 stock universe is re-ranked weekly to incorporate all price changes, earnings reports, and analyst estimate changes, and establishes a fair price for each stock in our universe.

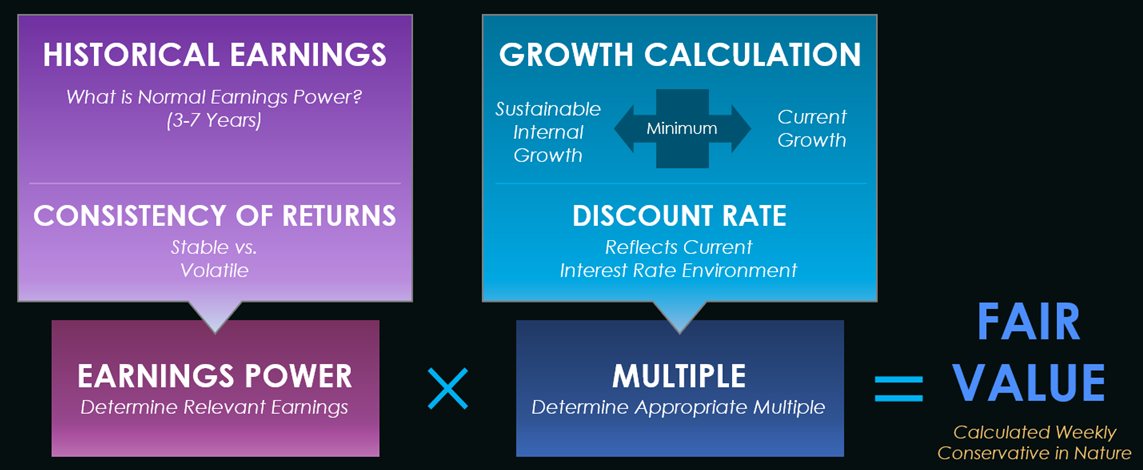
This value is based on two factors:

  • The normalized earnings power of that company.
  • The multiple placed on the company’s normalized earnings power
The appropriate multiple for each company is based upon the company’s return on investment, its reinvestment rate, and a discount rate. Earnings power is derived from past earnings, estimated earnings, and the company’s demonstrated ability to grow its earnings. Faster growing companies command a higher price to earnings multiple than slower growing companies, but also appreciates that slower growing companies are more likely to continue attaining historical growth rates. Stocks are then ranked one to eight hundred based on relative attractiveness/discount to Fair Value. Those companies trading at the largest discounts are more likely to provide above average investment return.

See the schematic below for a simplified illustration of how the Fair Value Model works.


DISCLAIMER: Cornerstone Investment Partners, LLC, in providing the service/information, believes that the information it uses comes from reliable sources, but does not guarantee the accuracy or completeness of this information, which is subject to change without notice, and nothing in this document shall be construed as such a guarantee. Cornerstone disclaims any liability arising from use of this service and its contents. Nothing herein shall constitute or be construed as an offering of financial instruments or as investment advice or recommendations by Cornerstone of an investment or other strategy (e.g., whether or not to "buy", "sell", or "hold" an investment). The information available through this service is not based on consideration of a subscriber's individual circumstances and should not be considered as information sufficient upon which to base an investment decision. You should determine on your own whether you agree with the content. This service should not be construed as tax or accounting advice or as a service designed to facilitate any subscriber's compliance with its tax, accounting or other legal obligations.
Past performance is not indicative of future results.
The Fair Value Model is Cornerstone's proprietary tool which aims to identify companies with a greater chance to outperform. These companies are ranked using Cornerstone's Fair Value Methodology.
© 2019 Cornerstone Investment Partners, LLC
Terms of use   |   Privacy policy
Loading...
Stock Split
Enter the Split Ratio.

This will automatically adjust Shares Outstanding, Price, EPS, Dividend and EPS Forecasts according to the Ratio.

The history will also be modified and you will not be able to undo the Split action.

For


Last Report Year (For Roll-Overs)

Type Last Report Year for the Company. Type -1 to use the Last Annual Report Year available in the Data-Base.

Note: When specifying a year different, some company data may not reflect the most current information available in the Data-Base.


Specify Year: